ver. 0.1.2
Documents
- Account management
- Dashboard
- UPDRS prediction by deep learning models
- Version update
- Acknowledgement
Account management
Sign-up
To secure every user's data, every user should register an account with a valid email and confirm the account via our automatic email delivery system. Click the "Sign-up" button on the right-hand side of the header. User should fill out the signup forms, as shown in Figure 1.

After the sign-up procedure, you will receive the following message (Figure 2.). You then have to check your email and click the confirmation link to activate your account.

After clicking the confirmation link, you are qualified to use.
Login
Click the "Login" button, you could login to the dashboard (Figure 3.).

Account modification
Click the "account" button, you can modify your account's password (Figure 4.) or delete your account.

Other Q&As
-
Forget password?
Ans: click the "Forget your password?", the system will automatically sent you an email for resetting password. -
Didn't receive confirmation letter?
Ans: click the "Didn't receive confirmation instructions?", the system will automatically sent you an email for account confirmation.
Dashboard
To start with, select the feature type. For example, click the "Finger tapping" on the sidebar. The drop-down menu will be shown. In Figure 5., there are 3 items: Overview, Upload, Archive. See details below.

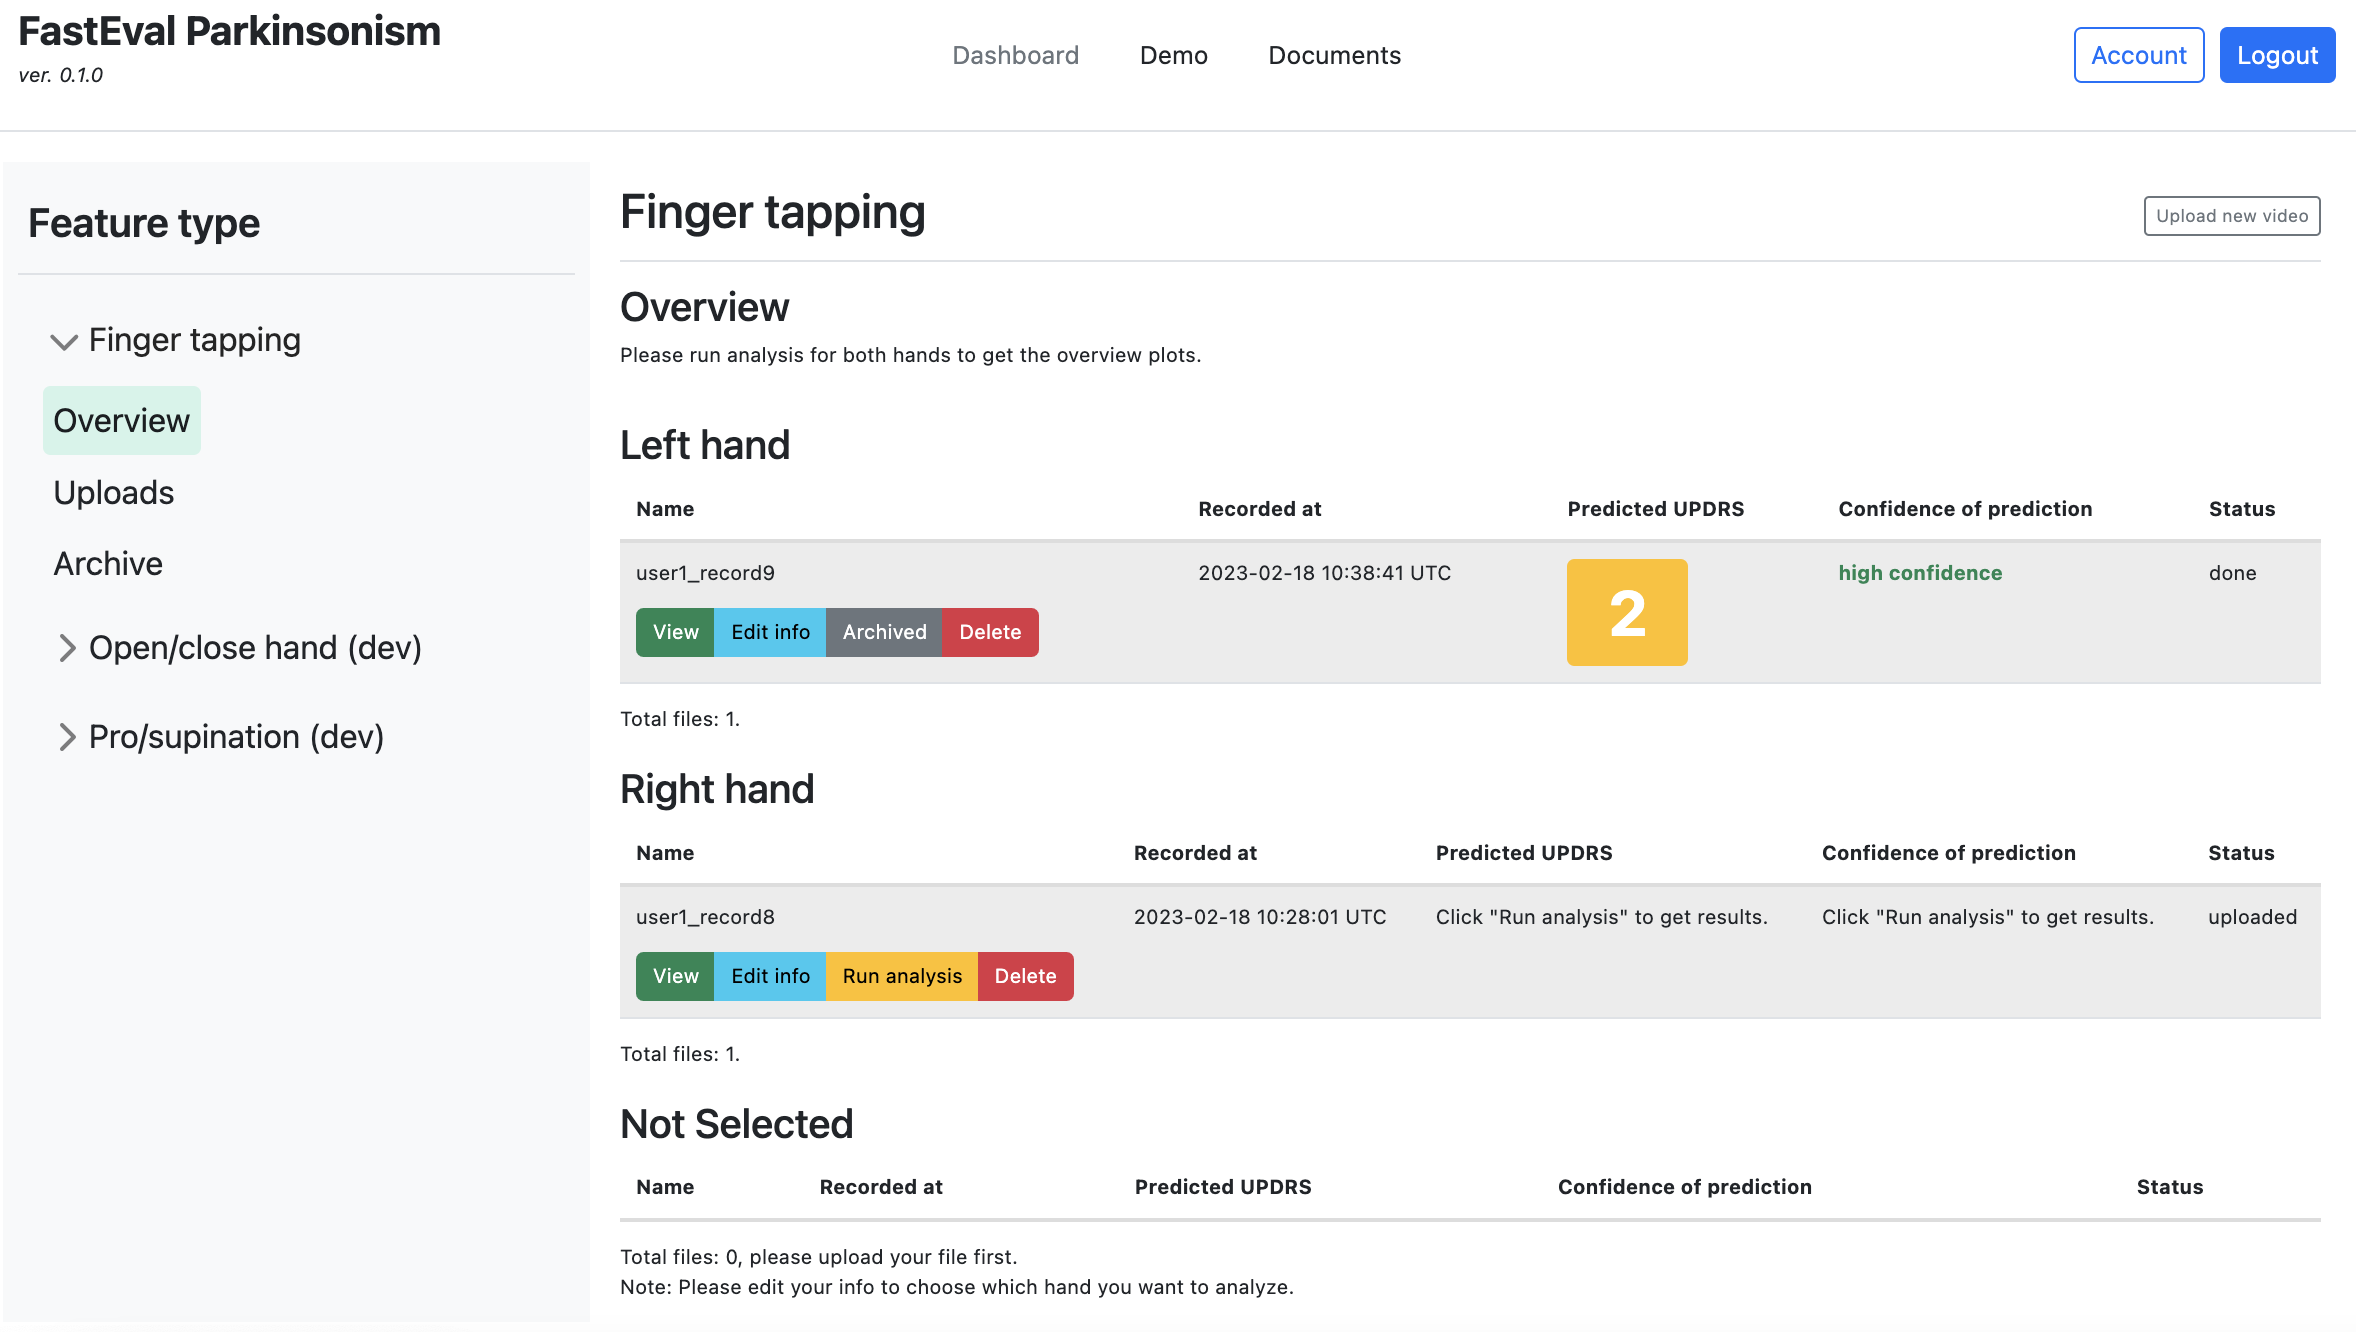
Overview
When you click the "Overview" button, no data include in your dashboard. You should upload your files first (Please see the instructions in "Upload" session).

After you upload files, your files will be classified to different tables based on the side of hand. You can choose the following buttons to operate your files.
- View: You can view your video by clicking this button.
- Edit: You can edit the recording time and the side of hand by clicking this button.
- Run analysis: You can run the analysis by clicking this button. NOTE: If you do not select the side of hand, you cannot analyze your video.
- Delete: You can delete your file by clicking this button.
Each video information will be shown in row (sorted by recording time), including Recorded at, Predicted UPDRS, Confidence of prediction, Status of the video. The "Recorded at" column records the timestamp you record (self-defined) the file.
Upload
Users should be awared of several things when uploading files.
- Data usage: Every user can upload videos up to 6 GB (including results). If you want to add more data, please contact us.
- Side of hand: To ensure the correctness of hand movement analysis, every user should select the side of hand correctly. If you do not select the side of hand, you could not allow to analyze the file.
- Date of recording: You can select the date and time when you record the video. The overview table will sort descendingly based on this timestamp. If you do not select any specific time, the system will regard the time you upload the file as default.
- Upload video: You can choose and upload file at the selection box and button, respectively. Each file should be less than 50 MB. The audio of your video will be automatically removed. Other files except for videos are not allowed to be uploaded. Side-view videos with more than 5 seconds, 720p and 60fps are prefered.

Archive
To organize your files, we offer a method for archiving your data. You can archive your file by single-clicking the "Archive" button and prevent yourself from accidental deletion (Figure 9.).

By clicking the "Archive" on the sidebar, you can access the archived data and unarchive them (Figure 10.).

View video & results
If you have not run analysis for your video, you can view your raw video and check the side of hand (Figure 11.). You can download the original file on the right side of the navigation bar.

If you have run analysis for your video, you can check your results (Figure 12.). All results, annotated MP4, raw hand keypoints, and image can be downloaded on the right side of the navigation bar.
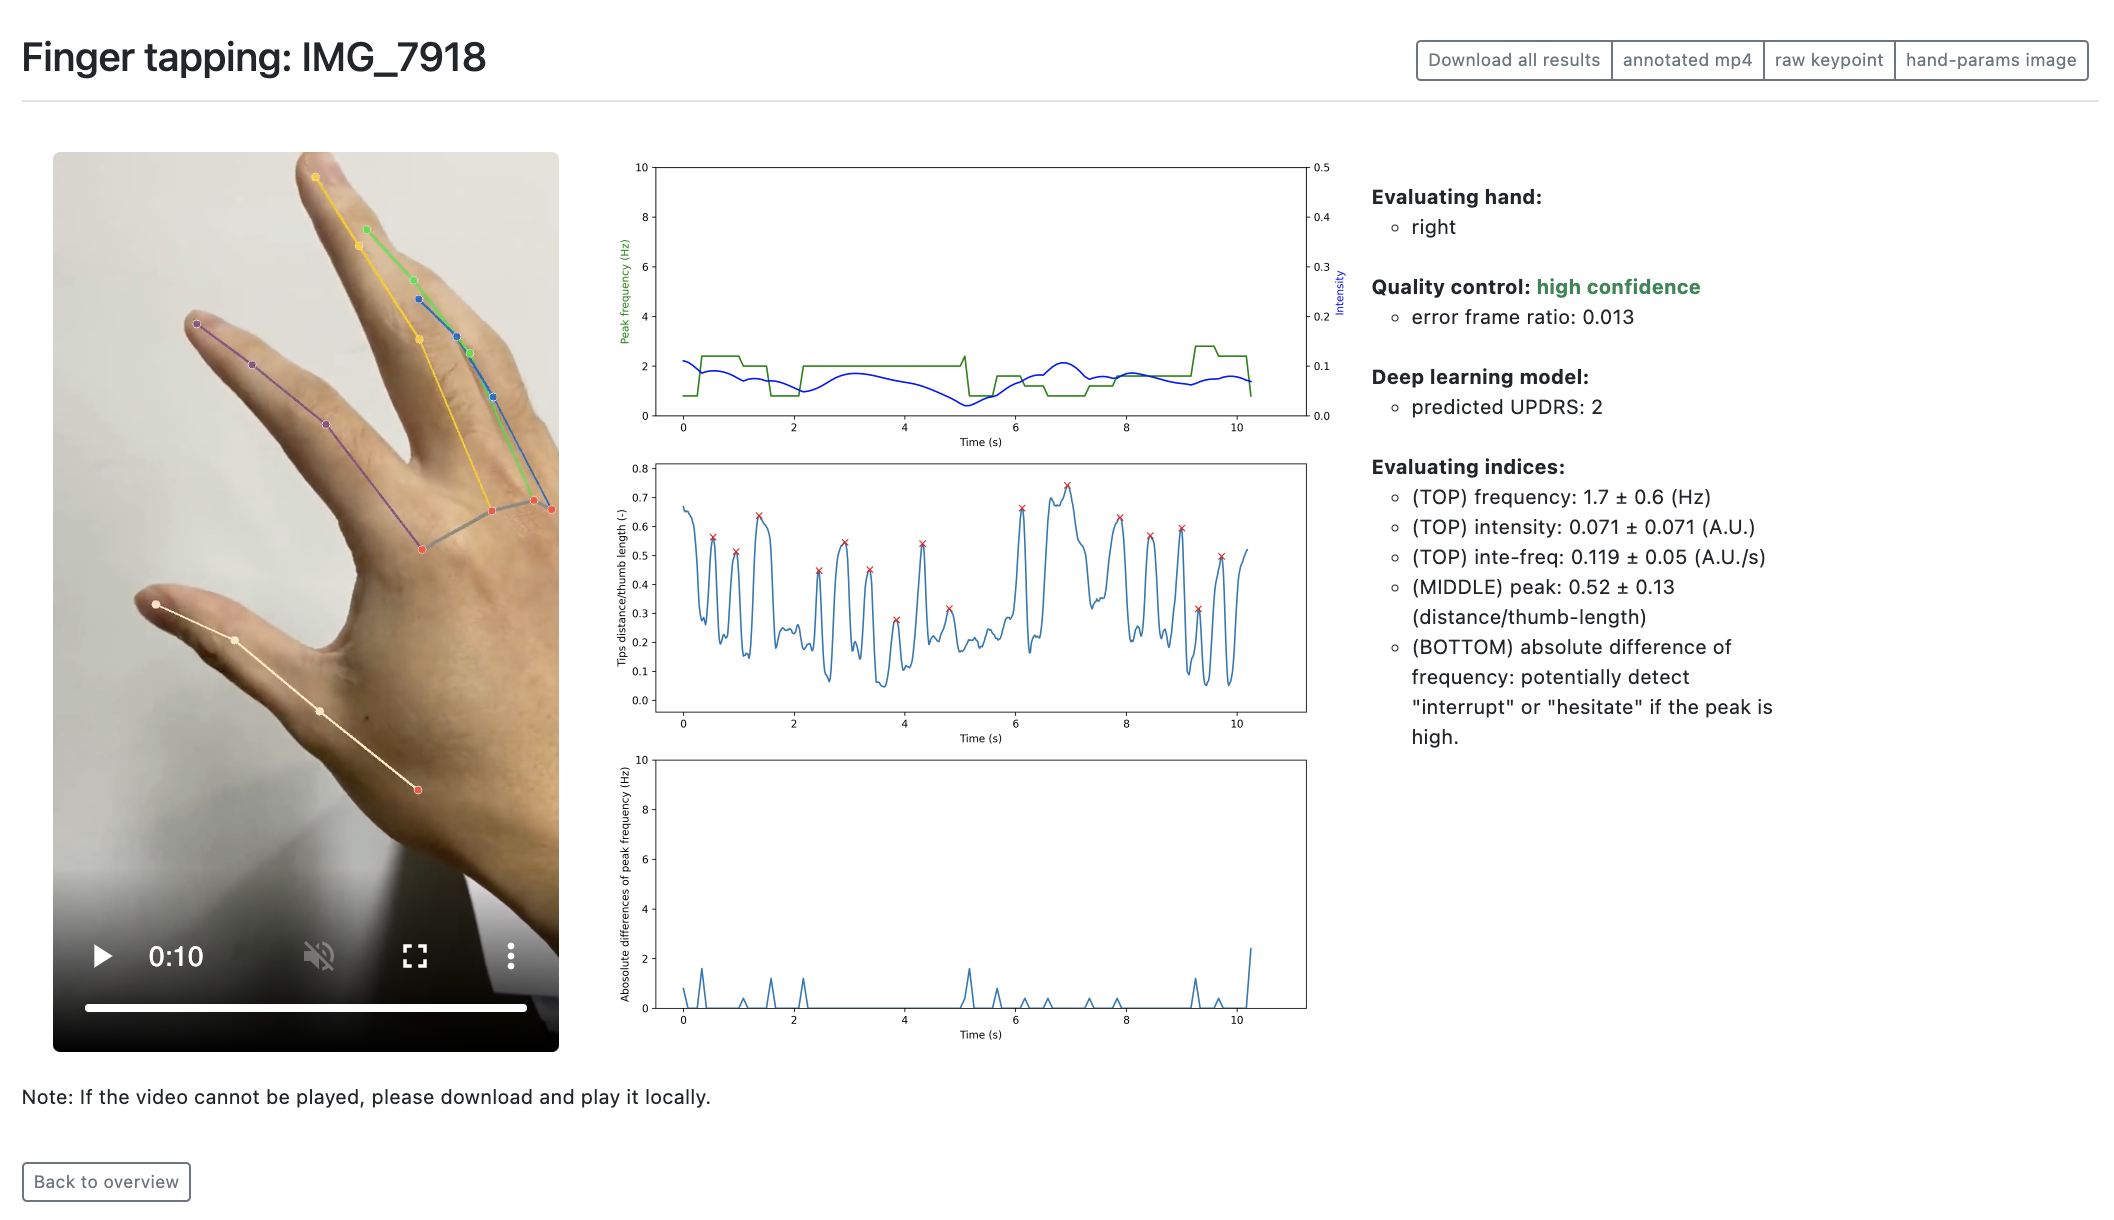
1. Quality control
Error frame ratio (frame error rate) is the ratio between the frame failing to extract key points and the whole video.
- high confidence: Error frame ratio = 0 ~ 0.16 (Most key points can be extracted.)
- moderate confidence: Error frame ratio = 0.16 ~ 0.5 (More than half of key points can be extracted.)
- low confidence: Error frame ratio = 0.5 ~ 1.0 (Less than half of key points can be extracted.)
2. Predicted-UPDRS score
Movement Disorder Society-sponsered Unified Parkinson’s Disease Rating Scale (MDS-UPDRS) covers various aspects of Parkinson’s disease including motor experiences of daily living. The tasks in MDS-UPDRS part III focus on motor examination, including finger tapping (3.4), hand movements (open/close, 3.5), and pronation-supination movements of hands (3.6). Our model is derived from the MDS-UPDRS score. Take finger tapping for example, the MDS-UPDRS score is classified to five categories based on the severity of the movement, as shown below. However, the evaluation of score 4 is not included in our model because it is clear to detect and recognize.
Instructions to examiner (finger tapping): Each hand is tested separately. Demonstrate the task, but do not continue to perform the task while the patient is being tested. Instruct the patient to tap the index finger on the thumb 10 times as quickly AND as big as possible. Rate each side separately, evaluating speed, amplitude, hesitations, halts, and decrementing amplitude.
- score 0 (Normal, healthy): No problems.
- score 1 (Slight, be aware of the decay of functionality): Any of the following: a) the regular rhythm is broken with one or two interruptions or hesitations of the tapping movement; b) slight slowing; c) the amplitude decrements near the end of the 10 taps.
- score 2 (Mild, highly recommend to see a doctor if it affects daily life): Any of the following: a) 3 to 5 interruptions during tapping; b) mild slowing; c) the amplitude decrements midway in the 10-tap sequence.
- score 3 (Moderate, must to see a doctor immediately): Any of the following: a) more than 5 interruptions during tapping or at least one longer arrest (freeze) in ongoing movement; b) moderate slowing; c) the amplitude decrements starting after the 1st tap.
- score 4 (Severe, must to see a doctor immediately but not included in our model): Cannot or can only barely perform the task because of slowing, interruptions, or decrements.
3. Quantitative parameters (evaluating indices)
In the finger-tapping task, we provided 4 quantitative parameters for cross-validation -- Frequency, Frequency-Intensity (inte-freq), Intensity, and Peak. In our workflow, after extracting key points by MediaPipe, we normalize each key point by subtracting the key point of the wrist and dividing by the median of the thumb's length over the video. Then, the distance between the thumb and index fingertips is calculated so that Peak (unit: actual-distance/thumb-length) can be extracted and annotated, as shown in the middle graph of Figure 12. Frequency (unit: Hz) and Intensity (unit: arbitrary unit, A.U.) is calculated based on a short-time Fourier transform, displayed in the top graph of Figure 12. In addition, the dot product of the frequency and intensity (inte-freq, unit: A.U./s) is calculated to represent the speed and amplitude of the movement. Compared to frequency or intensity merely, the dot product gives a more comprehensive view, considering the relationship between the times and action size of the hand movement. NOTE: The peak and intensity positively correlate (R2 ~= 0.78).
At the bottom of Figure 12., the absolute difference in the frequency is also calculated to detect "Interruptions" or "Hesitations". If interruptions or hesitations happened, the frequency would significantly change. Thus, if the absolute difference in the frequency is high, it might be a time of interruptions or hesitations. NOTE: the start and the end of the movement might also have a high absolute difference in frequency.
4. Compare between left and right side
To compare the left and right side of hand movement (e.g. finger tapping), we adopt a radar chart to illustration the difference in five dimensions (1 predicted-UPDRS score and 4 evaluating indices). Therefore, user can clearly view its strength and weakness of each dimension. In the radar graph, we linearly transform each indices to a 80-20 scale (80: best, 20: worst). The configurations of the linear transformation are from our collected dataset (n = 420), shown in the table below.

| Dimension | Score 80 (Normal) | 80 ~ 60 | Score 60 (Slight) | 60 ~ 40 | Score 40 (Mild) | 40 ~ 20 | Score 20 (Moderate or Severe) |
|---|---|---|---|---|---|---|---|
| Predicted-UPDRS | 0 | 0 ~ 1 | 1 | 1 ~ 2 | 2 | 2 ~ 3 | 3 or more severe |
| Frequency (Hz) | 3.21 or more | 3.21 ~ 2.71 | 2.71 | 2.71 ~ 2.20 | 2.20 | 2.20 ~ 1.70 | 1.70 or less |
| Frequency-Intensity (A.U./s) | 0.267 or more | 0.267 ~ 0.197 | 0.197 | 0.126 ~ 0.197 | 0.126 | 0.126 ~ 0.0561 | 0.0561 or less |
| Intensity (A.U.) | 0.0820 or more | 0.0820 ~ 0.0650 | 0.0650 | 0.0650 ~ 0.0479 | 0.0479 | 0.0479 ~ 0.0308 | 0.0308 or less |
| Peak (tip-distance/thumb-length) | 0.531 or more | 0.531 ~ 0.476 | 0.476 | 0.476 ~ 0.421 | 0.421 | 0.421 ~ 0.366 | 0.366 or less |
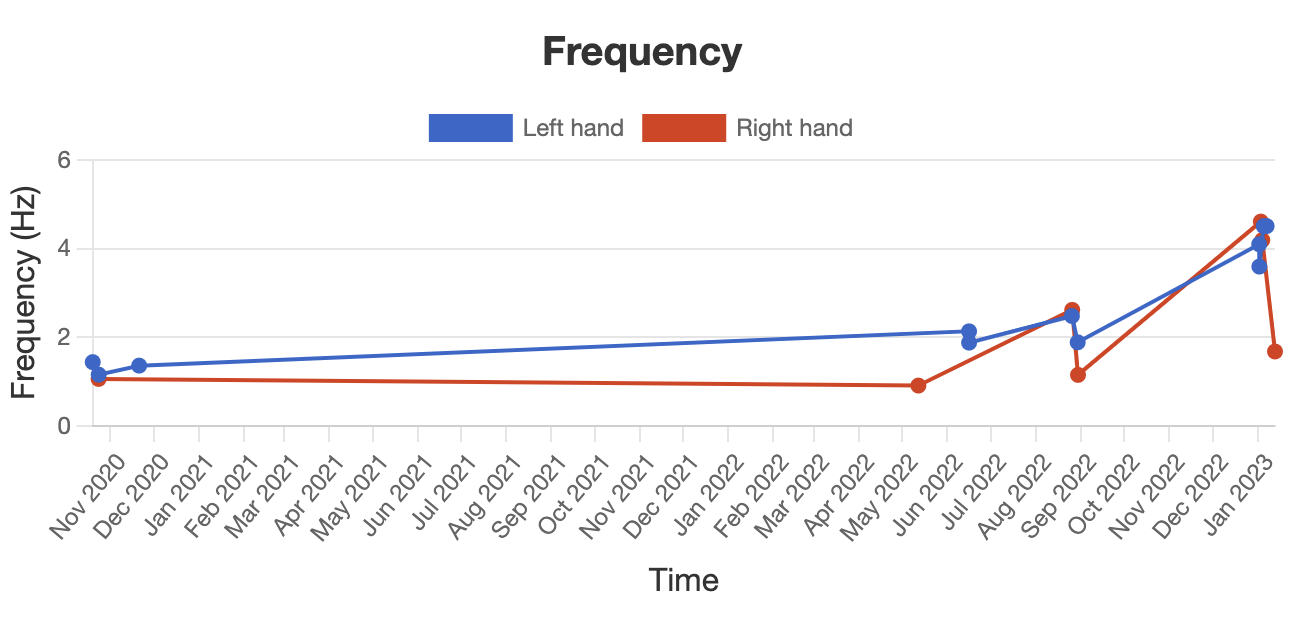
5. Track over time
The evaluating index can be expressed over recording datetime. Figure 14. shows an example of the frequency over time.
UPDRS prediction by deep learning models
Figure 15. demonstrates how we predict the UPDRS score for a given video. First, you can upload your video via website interface. At the same time, the side of hand is chosen. Before model prediction, hand key points are extracted from the hand video by MediaPipe. Error frame ratio (can be regarded as the quality of the video) is calculated from the raw key points. The hand key points then are transformed to normalized key points. If the error frame ratio is no less than 0.5, the model cannot predict the result. Because we have excluded the low confidence data when training our models. In our predicting module, there are three deep leraning (DL)-based binary classifiers for each side of hand. These three DL-based classifiers in one side of hand represent three difference hyperplanes of the severity. For example, the DL-based classifier 2 is the hyperplane for "score 1 and below" and "score 2 and above". If the score is 1 and below, the DL-based classifier will give a result of 0 (negative), and vice versa. After three classifications, all 1 (positive) and 0 (negative) results will be added to the predicted-UPDRS score.
NOTE: Because of the clearness of the severity type between score 3 and score 4, our predicting module are not included the hyperplane for "score 3 and below" and "score 4".

Version update
Acknowledgement


